
1. From the main left-hand menu, select System, then click Settings.
 |
2. Update your settings as follows:
- Language - select from English, Spanish, Portuguese, or Turkish, then click OK to confirm.
- Temperature units - select either Celsius or Fahrenheit.
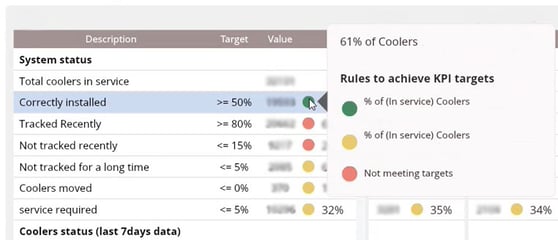
- KPI popups - Select Show KPI popup links if you would like to see more detail when you hover over Key Performance Indicator (KPI) items in your dashboards. (See example below).
Ignore the button called DELETE LOCAL CACHE. This functionality relates to an earlier version of Report app and is scheduled for removal.
Edit report parameters
These values are used throughout Report app. Update their settings to your preference then click SAVE to apply them across dashboards within the app.
- Out-of-spec sale temperature - This parameter identifies if data uploaded to Report app from connected equipment is within the preferred temperature for sales, or not. It is applied on a 30min-by-30min basis to ensure the temperatures are maintained accurately over time and it is summarised both daily and weekly to create a historical record.
- Exclude recent data if older than X days - This parameter changes the cutoff period for data that you can view in dashboards throughout Report app. For example, if you select 30 days and there are at least 5 days of recorded data in the last 30 days, you will see that data in the report. If there are less than 5 days recorded data in the last 30 days, you won't see information in the dashboard.
If you can't see data for the last 30 days, try extending this period to 45 or 60 days to see if more data is available.
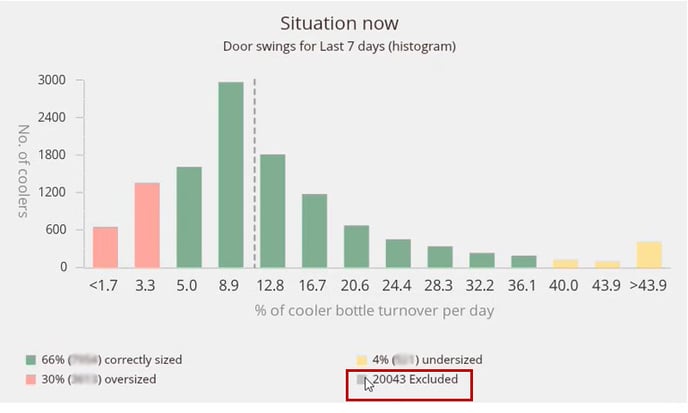
- If data has been excluded from a dashboard due to your choice in this option, the dashboard will include a note in the summary to say how many uploads have been excluded. See image below.
- Currency Symbol - This parameter is used in the Average Daily Power Consumption graph when viewing a dashboard for a specific piece of equipment.
- Energy Cost - This parameter is used in the Average Daily Power Consumption graph when viewing a dashboard for a specific piece of equipment.
Edit Custom Fields
This section lets you specify custom fields in your reports. For example, you might choose to group equipment by a sales territory, build date, or sales manager.
To create a new field, click + NEW FIELD then complete the Title, Type (String or Numbers), and Options (these will appear as a dropdown next to individual equipment). When you are viewing a dashboard, you can use these fields to filter the data and dig deeper into the detail.
Edit Model
Similar to Edit Custom Fields, this section lets you specify custom fields in your reports - but mainly to measure sales performance. For example, you might choose to group equipment models by description, product type, capacity, or door numbers.
The fields entered here also appear under the editable section in Report app called Cooler model (Go to System, then click Cooler model to view and update this section).
To create a new field, click + NEW FIELD then complete the Title, Type (String or Numbers), and Options (these will appear as a dropdown next to individual equipment). When you are viewing a dashboard, you can use these fields to filter the data and dig deeper into the detail.